

/analytics
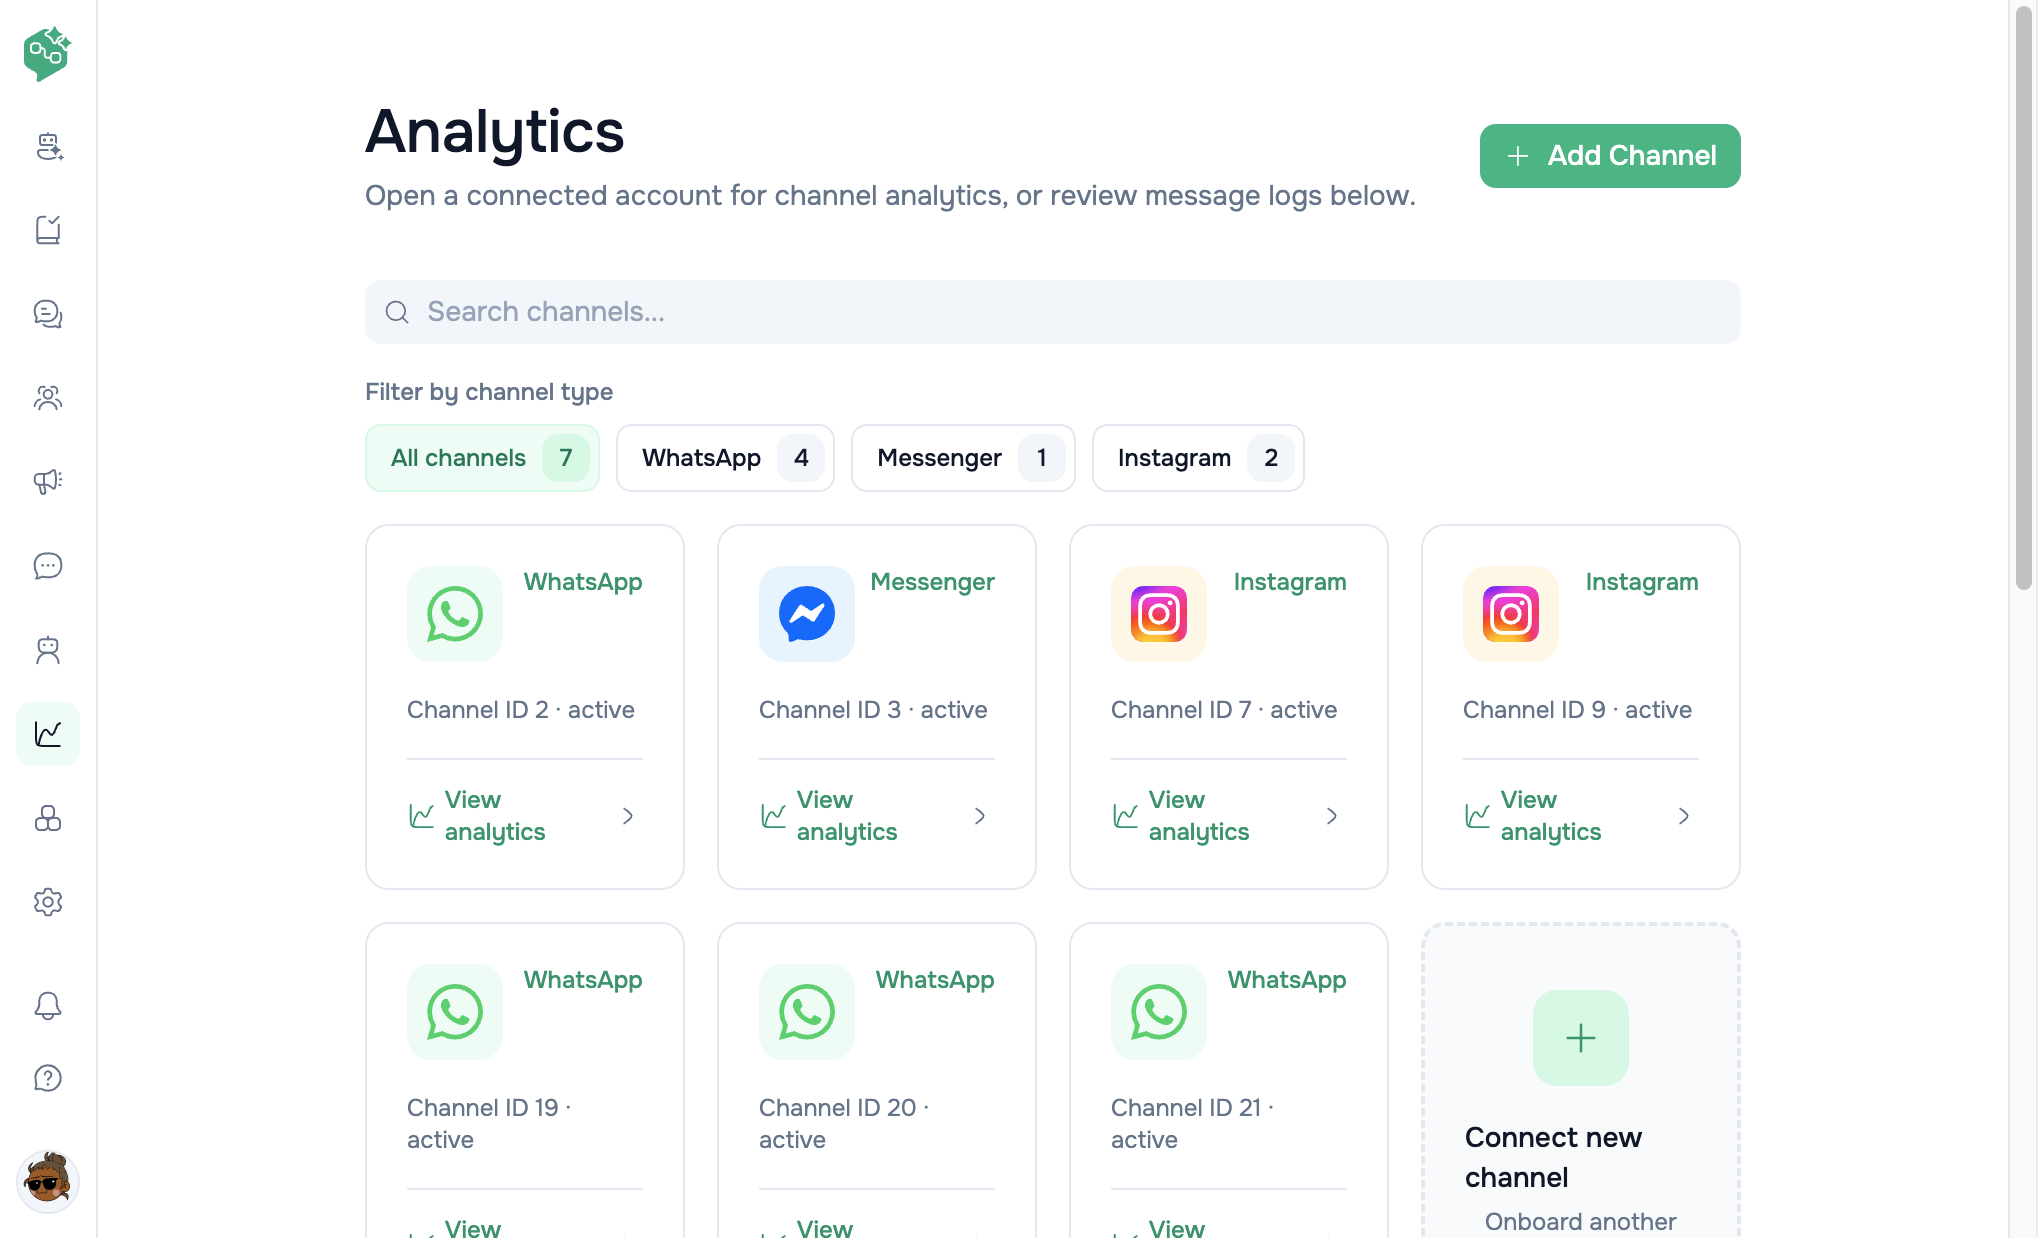
Analytics home
Quick reference
Example: TeaCircle Subscription
TeaCircle runs WhatsApp renewal reminders. Marketing lead Leo tests two template wordings.
Leo opened Analytics → WhatsApp Business account → Template performance, selected each template, compared read rate and button clicks, then exported CSV for the leadership deck.
Lesson: Wait 24 hours after a broadcast before judging read rate — WhatsApp read receipts lag for some users.
Analytics vs Co-Admin — when to use which
Rule of thumb: Overview now → Co-Admin. How did it perform over time? → Analytics.
How to navigate Analytics
Step 1 — Open Analytics home
- In the left sidebar (or More on mobile), click Analytics
- You land on Analytics with:
- Page title: Analytics
- Description: “Open a connected account for channel analytics, or review message logs below.”
- Add channel button (top right) — same as adding a channel from settings
/analytics
Step 2 — Pick a channel
The channel grid shows every messaging account in the current workspace:
Find channels faster:
- Search — filter by name, identifier, or channel type
- Filter by channel type — All channels, WhatsApp, Messenger, Instagram, Other
Step 3 — Open WhatsApp analytics (full dashboard)
Click View analytics on a WhatsApp channel. URL pattern:/analytics/whatsapp/{channelId}
You see WhatsApp analytics with:
- Page description: “DB-powered WhatsApp messaging analytics. Default view is Last 7 days.”
- Back link: ← All analytics
- Refresh button — reload all sections (bypasses client cache; server may still serve cached aggregates for up to ~10 minutes)
- Date range controls (see below)
- Summary stat cards
- Message trend chart
- Conversation type & top countries
- Template performance
- Message logs (fully functional here)
Other channel types
Non–WhatsApp / Messenger / Instagram accounts link to/analytics/channel/{channelId}. The dashboard shows the same WhatsApp-only placeholder until analytics ships for that channel type.
Messenger & Instagram today
Routes exist (/analytics/messenger/{id}, /analytics/instagram/{id}) but the dashboard shows:
“Analytics is currently available for WhatsApp only.”You can still open these channels from the Analytics home grid; full performance charts are WhatsApp-only for now. Use Chat and Co-Admin for cross-channel thread activity on other channels.
Message logs on the Analytics home page
The Message logs section at the bottom of/analytics is a layout preview (sample rows). Filters and Export on that section are not connected to live data. For real, filterable logs, open a WhatsApp channel analytics page → scroll to Message logs (filters: All types / Sent / Received / Template; status; phone search).
Date range & time period
Presets
How to apply a new range
- Change Time period dropdown (and custom start/end if needed)
- Optionally use the calendar popover (“Choose dates”) for a visual range
- Click Apply — sections reload for the new window
Comparison to previous period
Summary cards can show % vs previous (e.g. sent vs prior window of equal length). The backend compares the current range to the immediately preceding period of the same duration.Summary metrics (top cards)
Four cards appear at the top of WhatsApp channel analytics:
Each card shows:
- Count for the selected period
- Subtext — differs per card:
- Sent —
% vs previous(period-over-period change in send volume) - Delivered — delivery rate (%)
- Read — read rate (%)
- Failed — failed rate (%)
- Sent —
Rate definitions
Note: Read rate is calculated on delivered messages, not on sent — a message must be delivered before it can be read.
What is excluded from counts
- Internal messages (team-only notes in threads) — not counted
- Inbound-only traffic — summary cards focus on outbound performance (use message logs for inbound)
Message trend chart
Section: Message trendSubtitle: Sent, delivered, read, and failed by day.
- Line chart with four series (sent, delivered, read, failed)
- One point per calendar day in the selected range
- Export →
whatsapp-analytics-timeseries.csv
- Spotting send spikes (broadcast days)
- Seeing deliverability drops after template changes
- Correlating failures with Meta outages or bad number lists
Conversation type
Section: Conversation typeVisualization: Pie chart Shows the mix of outbound message categories in the period, based on linked WhatsApp template category when the message used a template:
Export →
whatsapp-conversation-types.csv
Use it for: Understanding whether your volume is marketing-heavy (watch opt-in compliance) vs support/utility.
Top countries
Section: Top countriesShows: Up to 10 countries by message volume Based on the country field on contact records for messages in the range (inbound + outbound non-internal). Export →
whatsapp-top-countries.csv
Use it for:
- Regional campaign performance
- Staffing decisions (e.g. spike in Bangladesh vs US)
- Spotting bad data — many Unknown countries may mean incomplete contact profiles
Template performance
Section: Template performanceSubtitle: Reply rate and button response after a selected template send.
How to use
- Open Template performance
- Choose a template from the dropdown (lists templates for this workspace/channel; first template auto-selects when the list loads)
- Review metrics for the selected date range
GET .../analytics/templates) — see metrics reference.
Export →
whatsapp-template-performance.csv (includes button breakdown)
A/B testing workflow (like TeaCircle)
- Send broadcast A with template
offer_v1Monday - Send broadcast B with
offer_v2the following Monday (similar audience) - In Analytics, select each template with Last 7 days
- Compare read rate (summary) + reply rate + button breakdown
- Export both CSVs for stakeholders
Message logs (channel analytics)
Location: Bottom of WhatsApp channel analytics pagePagination: 10 messages per page
Filters
Filters combine with the global date range (must click Apply on date first).
Table columns
Message detail modal
Click any row to open Message log details:
Export logs →
whatsapp-message-logs.csv (respects type, status, phone, and date range filters; exports only the first page — 10 rows by default, not the full filtered set). Paginate through logs in the UI or call the API with per_page up to 50 if you need more rows in one export.
Troubleshooting with logs
Export & sharing
Every major section has Export (CSV download via browser):
Agency tip: Export CSV for clients instead of granting Meta Business Manager access. Screenshot summary cards for weekly standups.
After every broadcast — review checklist
- Wait 24 hours — read receipts settle
- Open Analytics → your WhatsApp channel
- Set range to Today or Last 7 days → Apply
- Check Read rate and Failed count vs last campaign
- Open Template performance for the broadcast template
- Filter Message logs by Failed — fix bad numbers in CRM
- Adjust next template, segment labels, or delivery mode
Workspace & permissions
Co-Admin analytics capabilities
Co-Admin can answer analytics-style questions without opening the dashboard:
Co-Admin cannot replace the full dashboard for: daily trend charts, CSV export, template button breakdown UI, or calendar custom ranges — direct users to Analytics for those.
Contact lookup rule: Co-Admin needs phone or email — names alone are not unique enough.
Common mistakes
Related docs
- Analytics overview — hub and route map
- Analytics metrics reference — formulas, statuses, data sources
- Analytics FAQ — customer question bank
- Broadcasts — campaigns + post-send review
- Plans & billing — Meta WhatsApp fees vs Vendschat subscription
- AI Agents overview — Co-Admin vs customer-facing bots